From Report to Roadmap: Why You Need a Custom Geotechnical Constraints Map
Don’t just read the risk. See it.
You’ve received your geotechnical report. It’s 50 pages of soil density tests, bore logs, and liquefaction analysis.
But for a developer or landowner, there is only one question that really matters: Where can I actually put the building?
05 Mar 2026 | 4 min read
Public databases and raw reports give you the data, but they don’t give you the answers.
At Eliot Sinclair, we believe data should simplify your project, not complicate it. That’s why our Geotechnical and GIS teams collaborate to turn complex data into a clear, visual tool: the Geotechnical Constraints Map.
Why Traditional Geotech Reports Aren't Enough
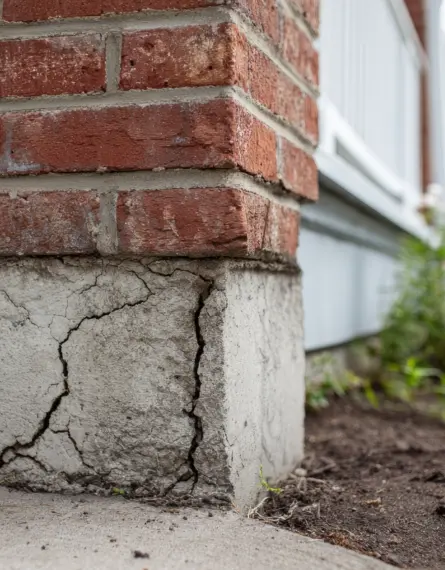
A traditional geotech report gives you the facts, but it doesn't always give you the spatial context. It might say "liquefaction risk in the north-east corner," but without seeing that overlaid on your site plan, you are effectively flying blind.
Relying solely on text-heavy reports often leads to:
- Wasted Design Time: Architects unintentionally designing structures over unstable ground.
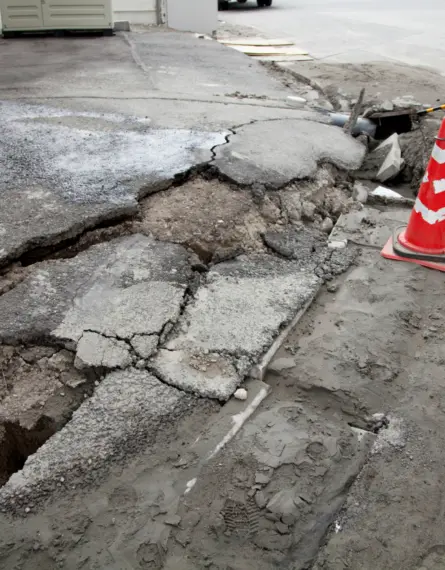
- Surprise Costs: Discovering the "best view" requires $50k in extra foundations during the pricing phase.
- Council Delays: Planners struggling to interpret how your design mitigates the specific hazards.
You don't just need a report; you need a roadmap.
What is Geotechnical Constraints Mapping?
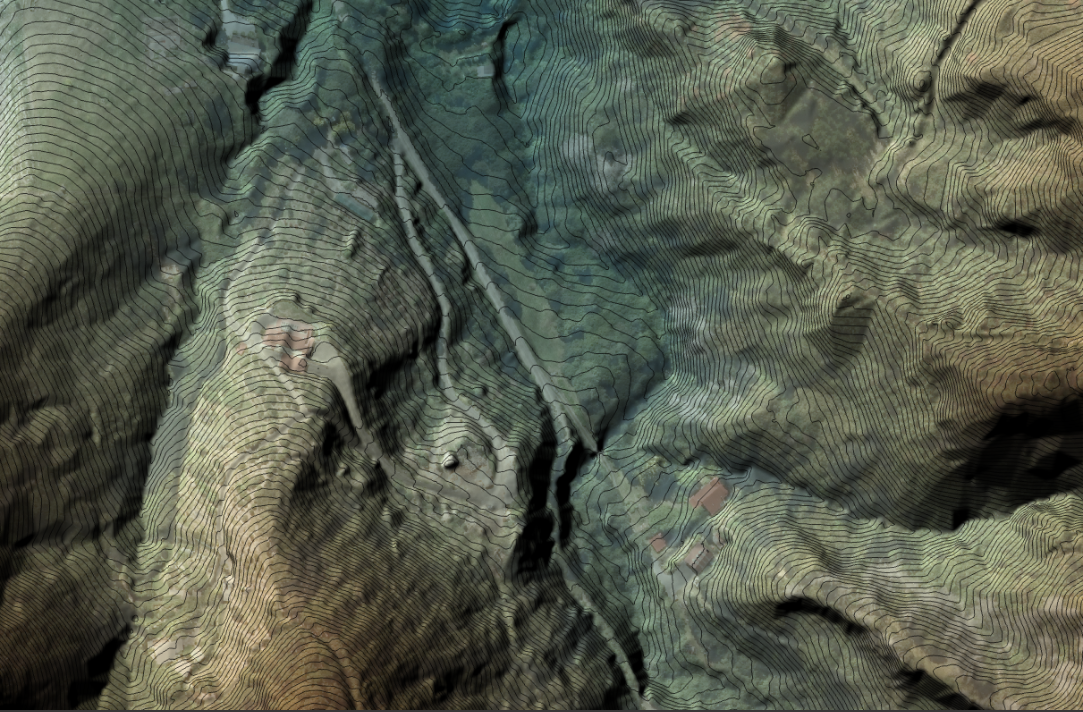
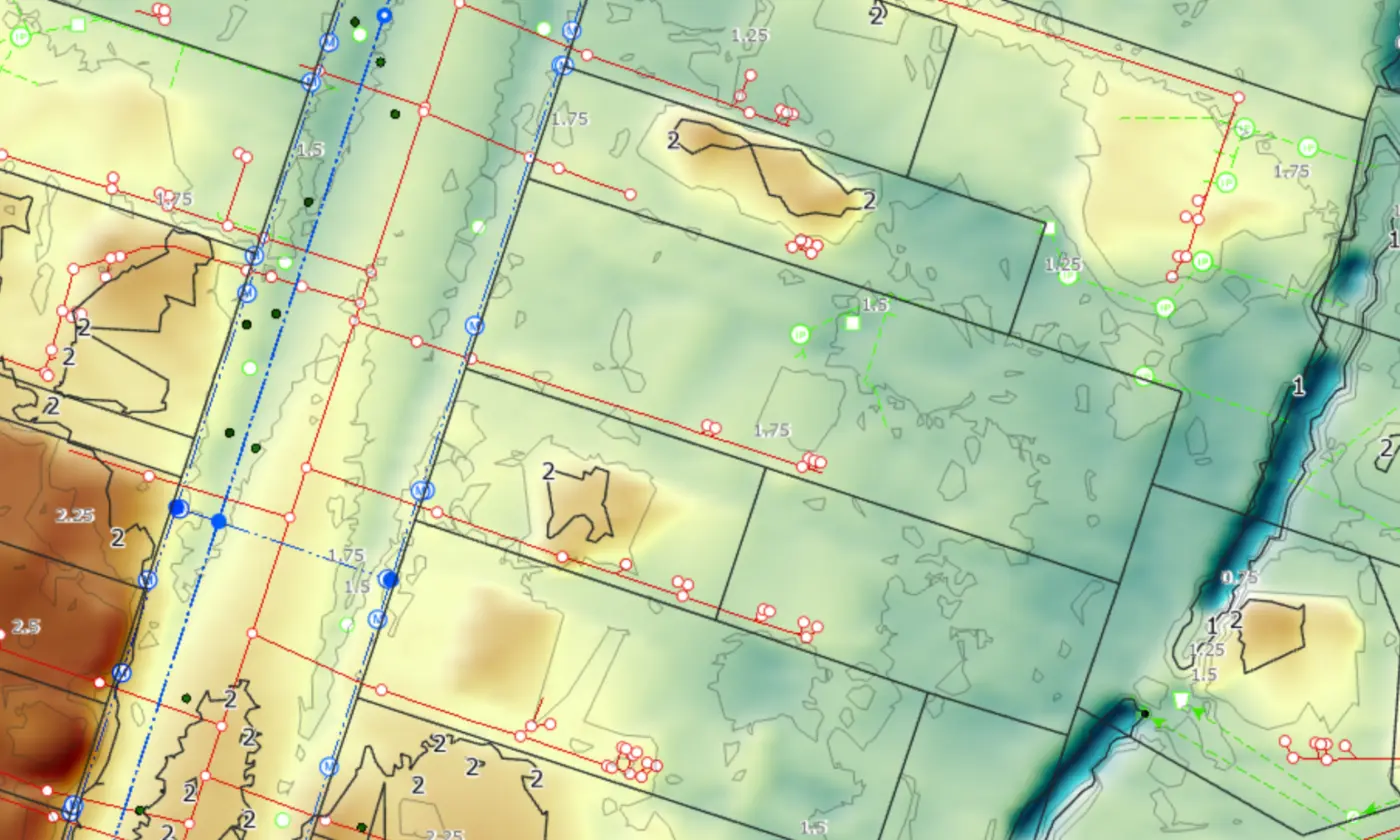
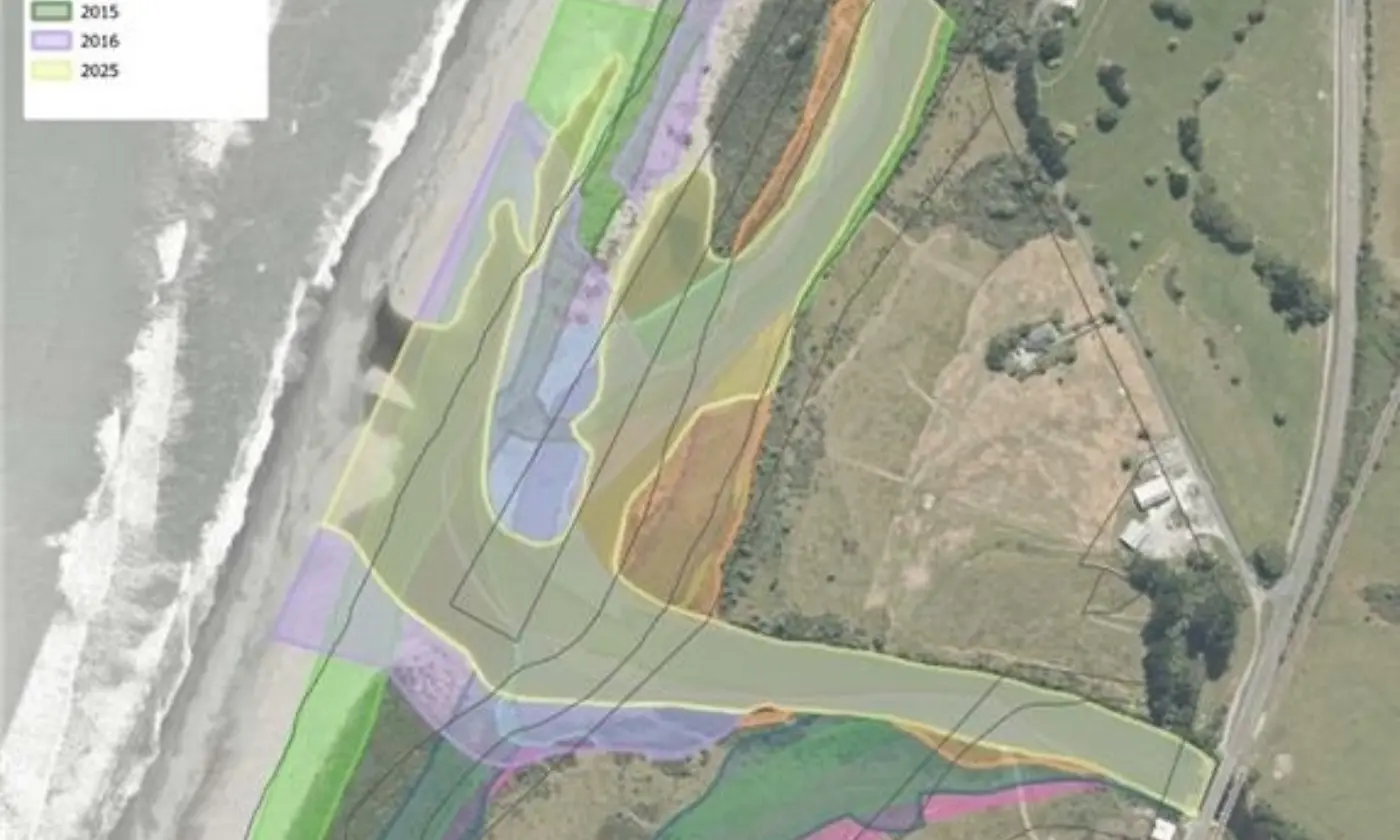
Geotechnical Constraints Mapping is a visual analysis tool that layers complex ground data such as slope stability, liquefaction risk, and soil density directly onto your site survey.
It translates raw scientific reports into a clear, colour-coded plan that identifies exactly which parts of a property are safe to build on, ensuring you don’t design structures over unstable ground.
You can think of it as a "Traffic Light" system for your land.
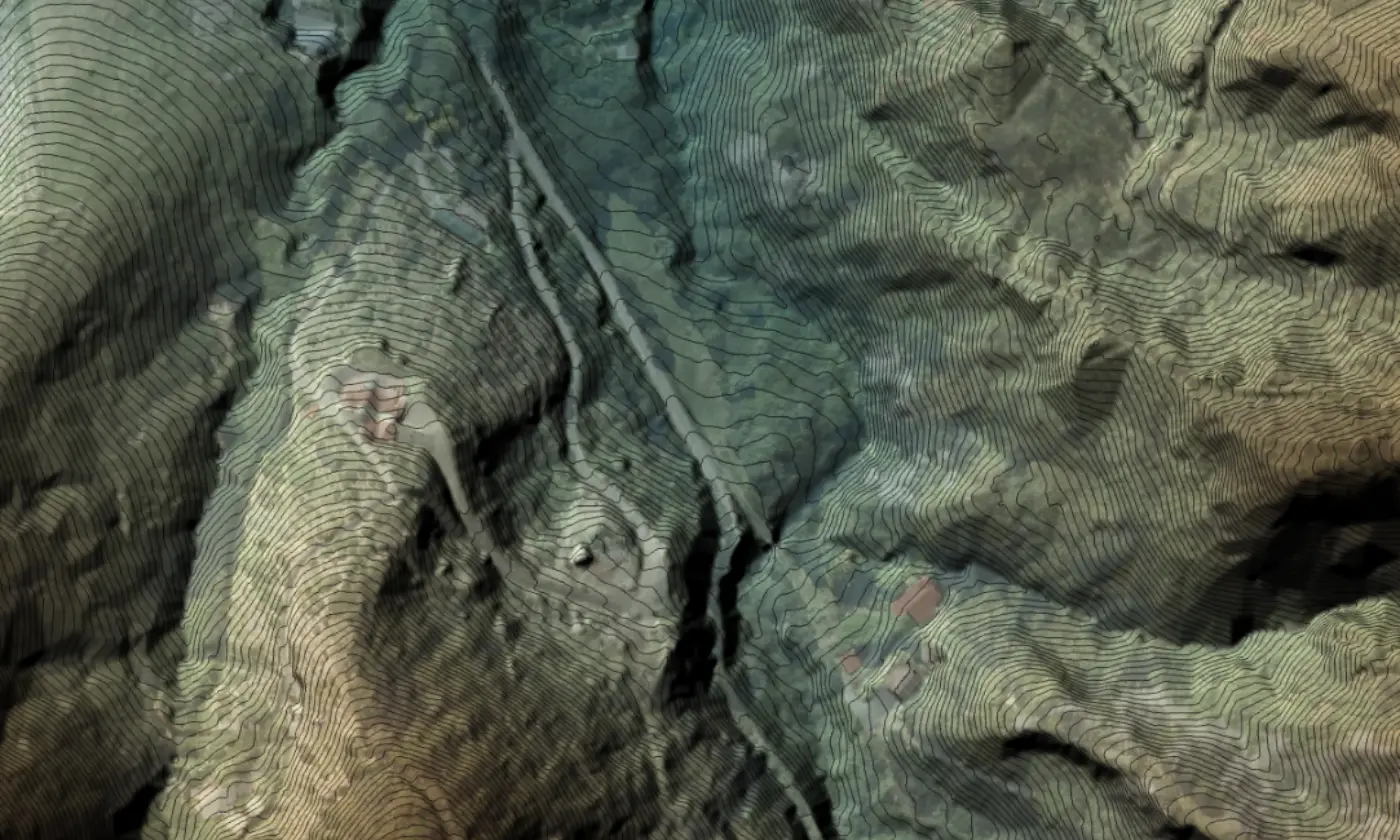
Unlike a static council overlay, this is a custom analysis of your specific site conditions. We take the data from our comprehensive geotechnical site investigations and our GIS team translates it into a single, easy-to-read plan that shows:
- Red Zones (High Constraint): "No-build" areas or zones requiring expensive engineering due to significant natural hazards.
- Orange Zones (Moderate Constraint): Buildable areas that may require specific foundation designs (e.g., ribraft or piles) to manage risk.
- Green Zones (Low Constraint): The "Sweet Spot" for cost-effective construction with standard foundations.
This process uses advanced spatial analysis to bridge the gap between scientific data and practical design.
De-Risking Your Development
For Commercial Developers: Site Suitability Analysis
In land development, time is money. A constraints map acts as your feasibility "crystal ball."
By overlaying these constraints before you start detailed design, you can optimise your lot layout to avoid the bad ground—saving potentially hundreds of thousands in earthworks and retaining walls. It allows you to perform a rapid site suitability analysis, turning a "maybe" project into a "definitely."
For Private Landowners: A Buildable Area Check
Building a dream home should be exciting, not terrifying.
A constraints map helps you avoid the stress of interpreting your standard geotech report. You can visualize exactly how the "technical terms" relate to your boundary pegs. You can see at a glance if your extension will hit a pipe or if your new build is too close to a bank.
Integrated Intelligence: The Eliot Sinclair Difference
This is the power of our integrated approach. We don’t just hand you a report and walk away.
Our Geotechnical engineers talk to our GIS team, who talk to our Civil engineers. We translate the science of the ground into the strategy of your development.
Whether you are looking at a single section or a large-scale subdivision feasibility, seeing your constraints early is the smartest investment you can make.
Let's talk.
Ready to see your project clearly? Contact our team to discuss how Geotechnical Constraints Mapping can streamline your next development.